
I’m sharing the best strava events of the day/week on social platforms
– former twitter
– threads
– bluesky.
– weekly stats on Instagram.
Efforts can be measured in Watts per kilogram
Duration, distance and elevation are the main ingredients to determine W/kg. Doing 6.0 W/Kg for 30 minutes is a better effort than 6.0 W/Kg for 15 minutes. But what if the 30 minutes effort was 5.6 W/kg? To compare them, I use one of the W/kg versus time curves by the Watt Police. This will result in a score. An effort that scores on the curve is score 100. Above the curve is a score above 100
Drafting
This is a problem. I just assume a race effort to have a low drag coefficient (CdA). And non-racing efforts are presumed without pacing. This is not always the case, but it is too much work for now to check each effort. If the rider shares power data, you could conclude if there was drafting involved. But about half of the activities are shared with power data.
For now this will identify the strongest efforts of the day. But a weekly or monthly list will be more “polluted” with non-race efforts using drafting
For non-race efforts I use CdA 0.324 for race efforts 0.150
Rider Weight and bike weight
If a 55 kg rider rides as fast as a 75 kg rider on the same segment, I assume the effort is equally strong. The W/kg will differ (the weight of the bike relative to the weight of the rider is different).
That’s why I use 65kg as a standard weight to calculate the w/kg and effort score. For the bike + gear I use 8.2kg.
With a lighter bike you can “cheat” the score.
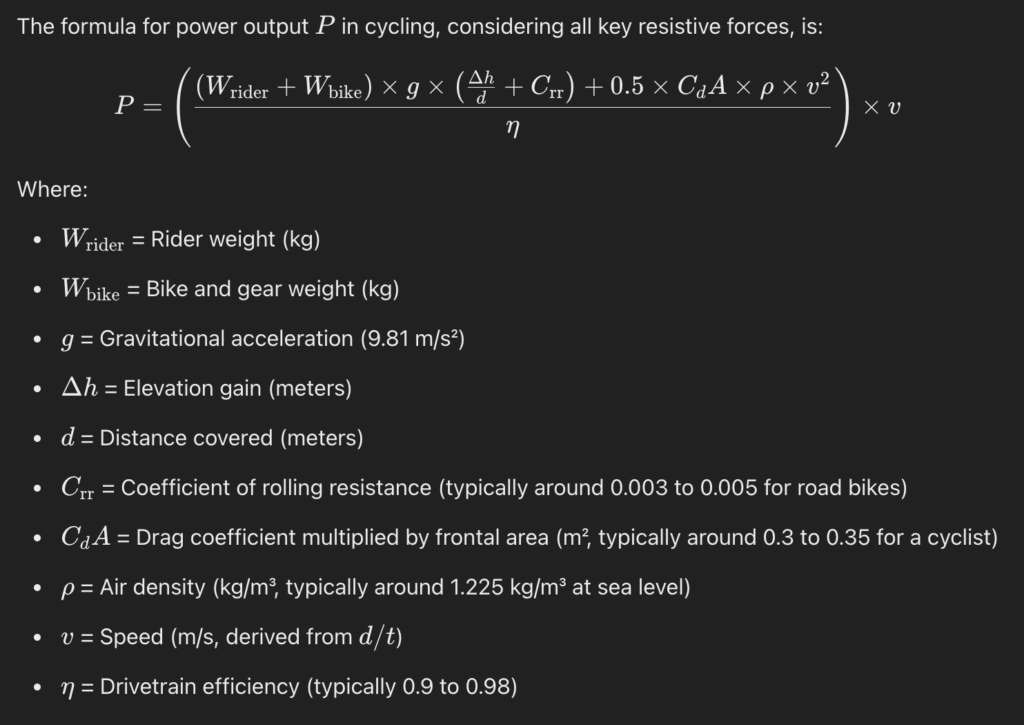
The formula
I’ve asked ChatGPT to define a formula based on James Martin’s method. The paper was a bit hard to decipher.
Distance and elevation
Strava can have some large errors in distance and elevation information for segments. I try to check the elevation data for each segment with a strong effort. And if the result is suspect I also try to check distance.